|
|
Electricity Balance
in millions of KWh (GWh)
Indicator
|
2002
fact |
2003
plan |
2003
fact |
Difference
fact to plan
2003 |
Difference
2003 to 2002
fact |
| Mln. KWh |
% |
Mln. KWh |
% |
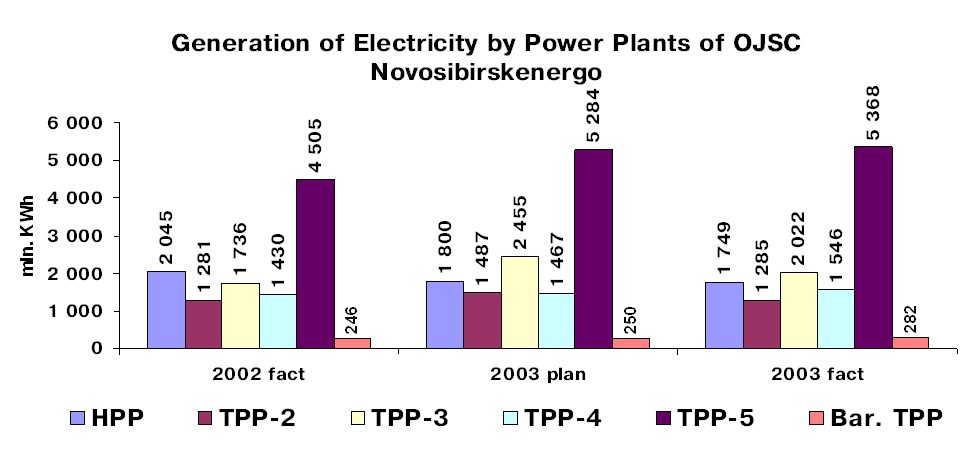
| 1. Electricity Generation, of which |
11,243 |
12,743 |
12,252 |
-491 |
96.1 |
1,009 |
109.0 |
![]() ![]() ![]() a) HPP a) HPP |
2,045 |
1,800 |
1,749 |
-51 |
97.2 |
-296 |
85.5 |
![]() ![]() ![]() b) TPP b) TPP |
9,198 |
10,943 |
10,503 |
-440 |
96.0 |
1,305 |
114.2 |
![]() ![]() ![]() ![]() TPP-2 TPP-2 |
1,281 |
1,487 |
1,285 |
-202 |
86.4 |
4 |
100.3 |
![]() ![]() ![]() ![]() TPP-3 TPP-3 |
1,736 |
2,455 |
2,022 |
-433 |
82.4 |
286 |
116.5 |
![]() ![]() ![]() ![]() TPP-4 TPP-4 |
1,430 |
1,467 |
1,546 |
79 |
105.4 |
116 |
108.1 |
![]() ![]() ![]() ![]() TPP-5 TPP-5 |
4,505 |
5,284 |
5,368 |
84 |
101.6 |
863 |
119.2 |
![]() ![]() ![]() ![]() Barabinsk TPP Barabinsk TPP |
246 |
250 |
282 |
32 |
112.8 |
36 |
114.6 |
| 2. Electricity Consumption |
12,584 |
12,743 |
13,080 |
337 |
102.6 |
496 |
103.9 |
![]() ![]() a) Sales a) Sales |
9,244 |
9,353 |
9,638 |
285 |
103.0 |
394 |
104.3 |
![]() ![]() b) Loss due to transportation b) Loss due to transportation |
1,909 |
1,727 |
1,890 |
163 |
109.4 |
-19 |
99.0 |
![]() ![]() c) Own consumption c) Own consumption |
1,249 |
1,469 |
1,379 |
-90 |
93.9 |
130 |
110.4 |
![]() ![]() d) Production purposes d) Production purposes |
109 |
108 |
113 |
5 |
104.6 |
4 |
103.7 |
![]() ![]() e) Services e) Services |
73 |
86 |
60 |
-26 |
69.8 |
-13 |
82.2 |
| 3. Purchased Electricity (without transportation losses) |
1,341 |
0 |
828 |
828 |
- |
-513 |
61.7 |
Heat Balance
in thousands of GCal
Indicator
|
2002
fact |
2003
plan |
2003
fact |
Difference
fact to plan
2003 |
Difference
2003 to 2002
fact |
| Thou GCal |
% |
Thou GCal |
% |
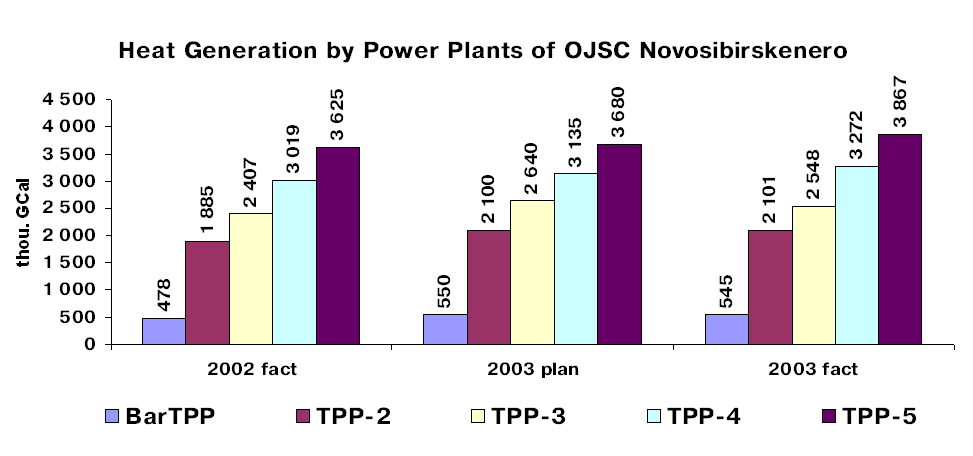
| 1. Heat Generation, of which |
11,428 |
12,121 |
12,347 |
226 |
101.9 |
919 |
108.0 |
![]() ![]() ![]() a) Electric Boilers a) Electric Boilers |
14 |
16 |
14 |
-2 |
87.5 |
0 |
100.0 |
![]() ![]() ![]() b) TPP b) TPP |
11,414 |
12,105 |
12,333 |
228 |
101.9 |
919 |
108.1 |
![]() ![]() ![]() Barabinsk TPP Barabinsk TPP |
478 |
550 |
545 |
-5 |
99.1 |
67 |
114.0 |
![]() ![]() ![]() TTP-2 TTP-2 |
1,885 |
2,100 |
2,101 |
1 |
100.0 |
216 |
111.5 |
![]() ![]() ![]() TTP-3 TTP-3 |
2,407 |
2,640 |
2,548 |
-92 |
96.5 |
141 |
105.9 |
![]() ![]() ![]() TTP-4 TTP-4 |
3,019 |
3,135 |
3,272 |
137 |
104.4 |
253 |
108.4 |
![]() ![]() ![]() TPP-5 TPP-5 |
3,625 |
3,680 |
3,867 |
187 |
105.1 |
242 |
106.7 |
| 2. Heat Consumption |
11,945 |
12,758 |
12,936 |
178 |
101.4 |
991 |
108.3 |
![]() ![]() a) Heat Sales a) Heat Sales |
10,371 |
11,200 |
11,381 |
181 |
101.6 |
1,010 |
109.7 |
![]() ![]() b) Loss due to transportation b) Loss due to transportation |
1,458 |
1,458 |
1,459 |
1 |
100.1 |
1 |
100.1 |
![]() ![]() c) Services c) Services |
116 |
100 |
96 |
-4 |
96.0 |
-20 |
82.8 |
| 3. Purchased Heat from Kirov regional boiler |
517 |
637 |
589 |
-48 |
92.5 |
72 |
113.9 |


Next
|
 |
|
|
|
